View Charts of Your Tracked Symptoms and Incidents
One of the most important features of symptom and events tracking is to see the changes over time. You can do that easily in the app by tapping “View History” on the symptom and/or vital you want to view.

Tap the View History button to see charts of symptoms and vitals
1. To view a chart of your incident/symptom, in the bottom right corner tap on the “view history” or “view chart” text.
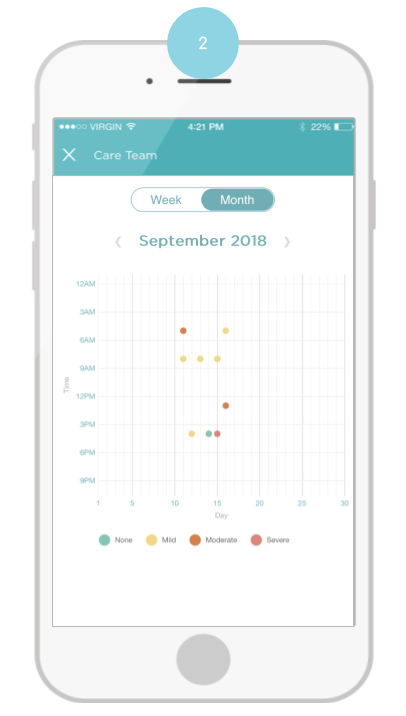
Tap Week/Month to toggle the view.
2 . Each chart shows the severity of the symptom or incidents over time and the severity as none, mild, moderate and severe symptoms
Now you can view your symptom history quickly for every symptom and incident you’re tracking!